This is draft
Compile your program using -g flaggcc hello.c -o hello -g
gdb hello
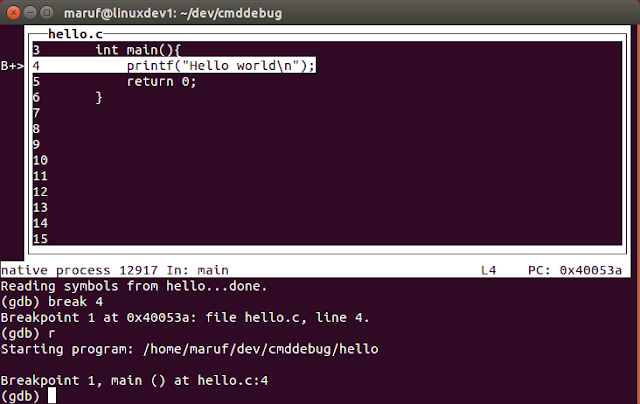
(gdb) l 1 #include2 3 int main(){ 4 printf("Hello world\n"); 5 return 0; 6 } (gdb) (gdb) l Line number 7 out of range; hello.c has 6 lines. (gdb) (gdb) break 4 Breakpoint 1 at 0x40053a: file hello.c, line 4. (gdb) r Starting program: /home/maruf/dev/cmddebug/hello Breakpoint 1, main () at hello.c:4 4 printf("Hello world\n"); (gdb)
Using console IDE
gdb hello --tui
Breakpoint
Step into
(gdb)s
Step over
(gdb)n
Other commands
r - untilp variable-name - show value clear line-number - delete breakpoint d - delete all breakpoints watch (gdb)info breakpoints (gdb) info breakpoints Num Type Disp Enb Address What 1 breakpoint keep y 0x000000000040053a in main at hello.c:4 breakpoint already hit 1 time (gdb)info watchpoints c - continue execution frame - show call stack (gdb) frame #0 main () at hello.c:4


No comments:
Post a Comment